By
WD8KNC

Other Screens
Normal Logging Screen
Off Hours
CW Practice
Contest Results
Memo Pad
The North America map can be viewed in five formats with a click of the mouse. The default view shows only the map and no lines. The lon/lat view (top right) displays longitude and latitude lines, the ITU and CQ zone views show their respective boundaries, and the Grid view (bottom right) shows North America with the standard grid lines used in VHF contesting.
As your cursor moves around the page the information at the top of the page changes instantly to show you the location, bearing, longitude, latitude, distance and grid number of the location under the cursor.
When you click the left button on the mouse the system can swing your antenna to that bearing and switch to the beverage antenna that has the correct orientation.
If the grid checkbox is checked and you click the left mouse button, the grid number of the location under the cursor will be displayed and a box will be placed in that location.
If you click the Show Contacts button the system will search your log entries and display one or more boxes in that location. The boxes will be color coded depending on the band used to make the contact.
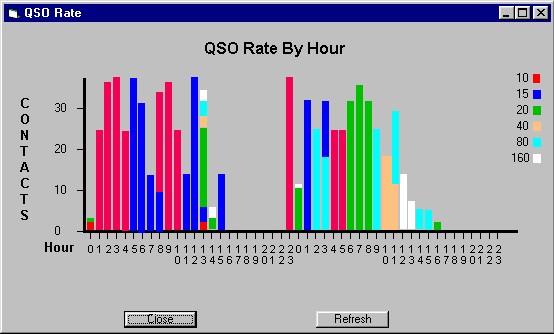
The QSO Rate Screen is a graphic representation of how well you are doing so far. The screen can be used to determine if you should go off and chase that multiplier or stay put. The bands are color coded so that you can tell how successful you have been on the different bands.
North America With Long/Lat lines

North America with Grid Lines

QSO Rate Screen
